Best 5 AI Prompts for Infographic Creation (Complete Guide for Designers)
- SriLakshmi M V

- Mar 10
- 4 min read

Infographics are one of the most effective ways to communicate complex information in a visually engaging way. Whether it’s a blog post, marketing campaign, presentation, or research report, infographics help transform dense data into content that is easier to understand and more memorable.
Traditionally, infographic design involves several steps: gathering data, planning layouts, selecting icons and charts, and designing visual hierarchy. While these steps remain important, AI tools are now helping designers speed up the initial stages of infographic creation.
With the right prompts, AI can generate infographic layouts, visual structures, and icon-based designs within seconds. Designers can then refine these outputs using tools like Figma or Illustrator.
This guide explores:
How AI Helps in Infographic Design

AI tools analyse prompts and generate visuals based on keywords describing layout, style, and visual elements. When creating infographics, prompts should ideally include:
Topic or Subject
Layout Style
Number of Sections
Visual Elements (charts, icons)
Colour Palette
Design Style
For example:
Weak prompt:
Create an infographic about AI.
Stronger prompt:
Create a vertical infographic explaining the growth of artificial intelligence adoption in businesses. Include data charts, icons, and a modern flat design style using blue and purple colours.
The stronger prompt gives the AI clearer visual instructions.
Key Elements of an Effective Infographic Prompt
Topic or Theme
Clearly describe the subject of the infographic.
Examples:
Artificial intelligence trends
Digital marketing statistics
Climate change data
Layout Direction
Infographics can follow several layout styles.
Examples:
Vertical infographic
Horizontal infographic
Step-by-step infographic
Timeline infographic
Data Representation
Specify the type of visuals needed.
Examples:
Bar charts
Pie charts
Icon illustrations
Process diagrams
Visual Style
Define the design aesthetic.
Examples:
Flat design
Minimal infographic
Corporate style
Editorial illustration
Best 5 Prompts for AI Infographic Creation
Data Statistics Infographic
Prompt:
"Create a vertical infographic explaining global artificial intelligence adoption in businesses. Include bar charts, statistics cards, and modern icons to visualise key insights. Use a minimal flat design style with a clean and professional aesthetic. The colour palette should primarily include blue, teal, and white. The layout should be structured as a clean vertical infographic that clearly presents trends, statistics, and AI adoption insights in businesses."
Result:

Timeline Infographic
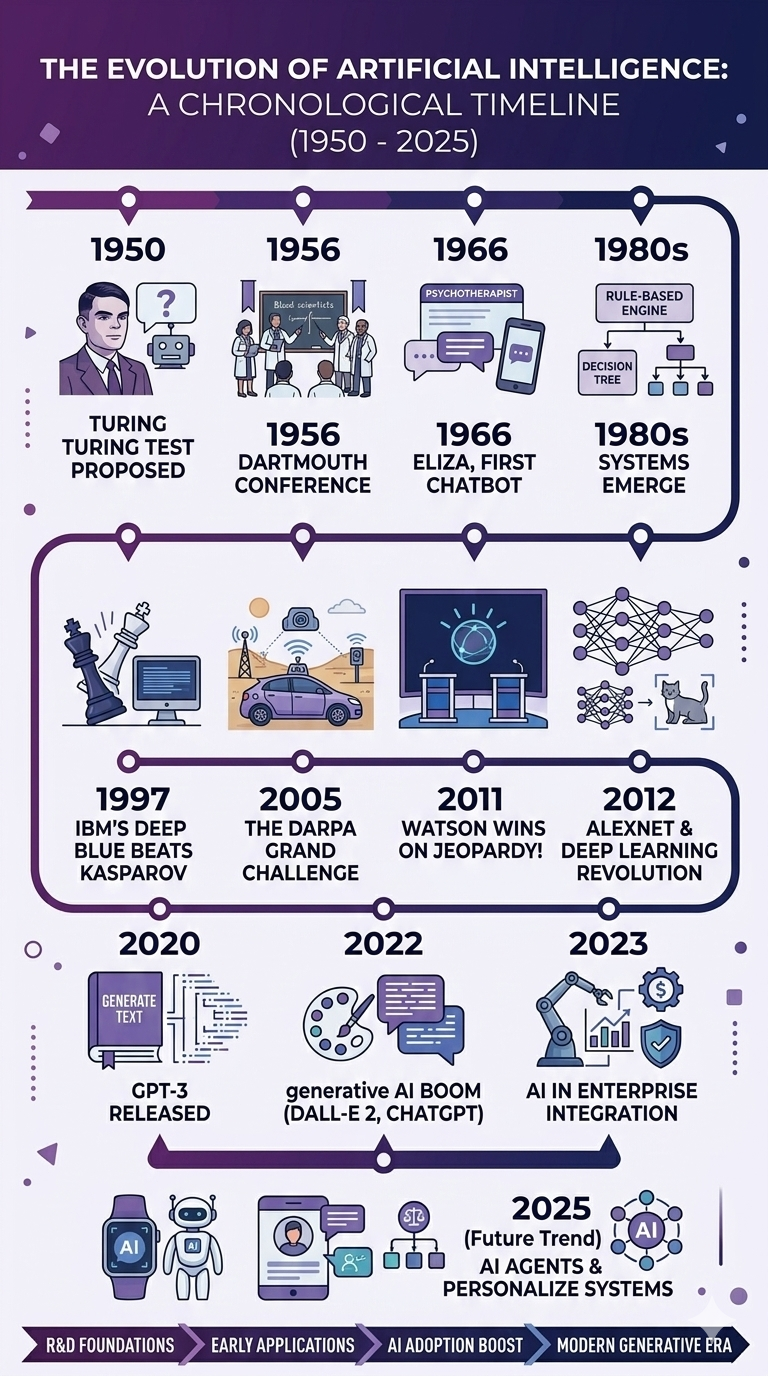
Prompt:
"Design a timeline infographic showing the evolution of artificial intelligence from 1950 to 2025. Include milestone markers and small icons representing key events across the timeline to visually highlight major breakthroughs and developments in AI. Use a horizontal timeline structure to clearly present the progression of AI history. The design should follow a clean and modern infographic style with a color palette of purple, dark blue, and white. The overall layout should remain minimal, structured, and easy to read while presenting the information in a clean vertical infographic format."
Result:
Process Infographic
Prompt:
"Create a 5-step infographic explaining the UX design process. The infographic should visually represent the key stages: Research, Wireframe, Prototype, Test, and Launch. Use clear sections or steps to show the progression of the design workflow, supported by simple icons or illustrations for each stage. The style should follow a modern flat illustration approach with a clean and professional look. Use a colour palette primarily consisting of blue and green to maintain a cohesive and visually appealing design. The overall layout should be structured, easy to read, and suitable for presenting the UX design process in a clear and engaging infographic format."
Result:

Comparison Infographic
Prompt:
"Generate a comparison infographic showing AI design tools versus the traditional design workflow. Structure the infographic using a clear two-column comparison layout to highlight the differences between the two approaches. Include visual elements such as icons, charts, and key statistics to effectively present advantages, processes, and efficiency comparisons. The design should follow a professional corporate infographic style with a clean, structured layout that makes the comparison easy to understand and visually engaging."
Result:

Educational Infographic
Prompt:
"Create an educational infographic explaining how machine learning works. The infographic should clearly illustrate the process, starting with data input, followed by the training model stage, and ending with prediction output. Use simple icons and visual elements to represent each step in the workflow so the concept is easy to understand. The design should follow a clean and simple educational diagram style, making the information visually clear, structured, and suitable for explaining machine learning concepts to beginners."
Result:

Best AI Tools for Infographic Creation
Free AI Tools:
These tools are beginner-friendly and useful for quick visual concepts.
Paid AI Tools:
Paid tools generally offer higher-quality visuals and more creative control.
Tips for Better Infographic Prompts
Specify layout orientation
Include number of sections
Define color palette
Mention icon usage
These details help AI generate structured infographic designs.
Limitations of AI Infographic Generation
AI can generate layouts but may struggle with:
accurate data placement
readable typography
consistent spacing
Designers should refine AI outputs using professional design tools.
Conclusion
AI tools can significantly accelerate the early stages of infographic design by generating layouts, icons, and visual concepts quickly. When combined with human design expertise,
AI can help produce visually compelling and informative infographics more efficiently.


Comments